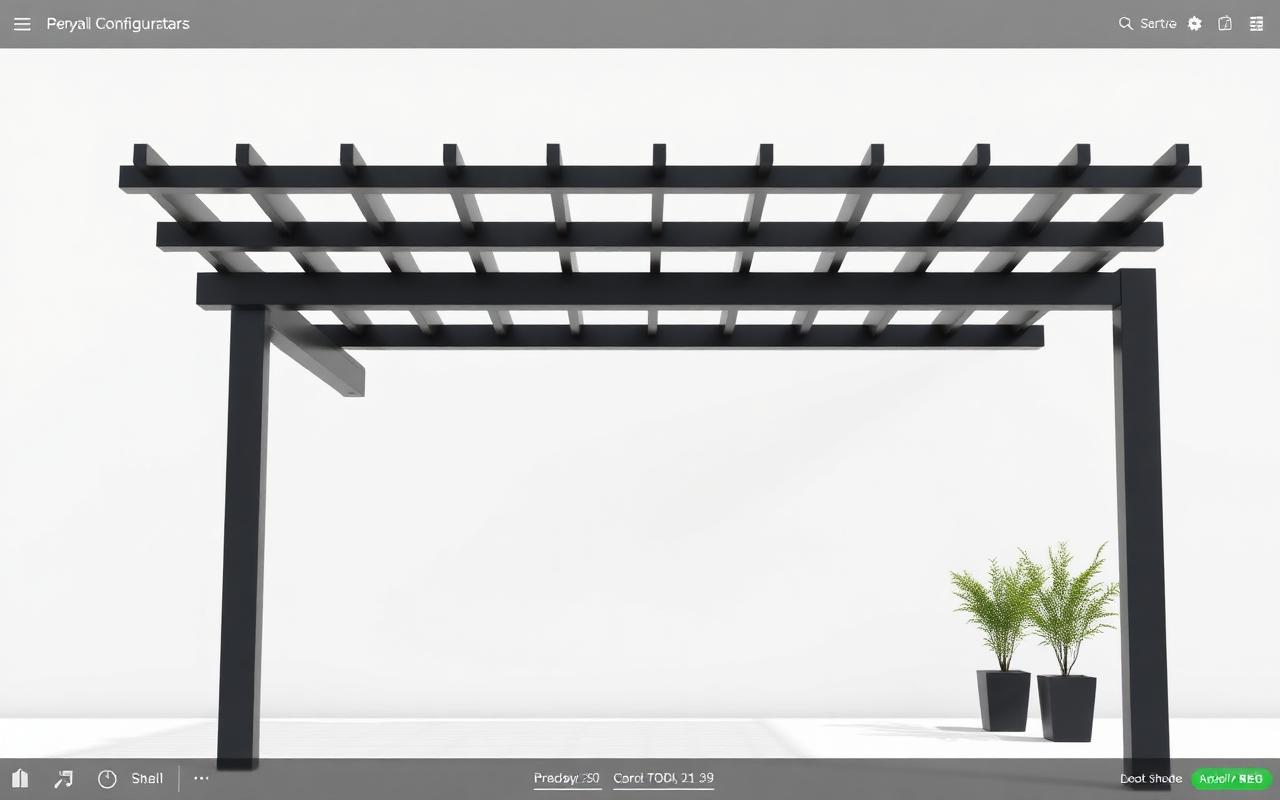
7 KPIs to Prove ROI from a 3D + AR Configurator for Pergolas
Seven KPIs installers and manufacturers must track after launching a 3D+AR configurator for pergolas and awnings — with targets and how Configurix's real-time 3D, AR and auto-pricing drive them.
Introduction
If your business sells pergolas, verandas or awnings, a 3D + AR configurator can be a game changer — but only if you measure the right things. This guide lists seven clear, actionable KPIs you should track after launching a configurator, how to calculate them, benchmark targets, and exactly which Configurix features move each metric.
Why KPIs matter now
Interactive 3D and AR are no longer novelty features; they change buyer behavior and shorten sales cycles. Measuring the right KPIs lets you prove ROI to stakeholders, prioritize feature work, and scale dealers or installers without losing quality. Industry research shows meaningful conversion and engagement lifts from 3D/AR adoption. (3dcloud.com)
How to use this guide
For each KPI below you’ll get: definition, how to measure it, a realistic first-year target for a Configurix deployment, and the Configurix features that directly improve the metric. Use your CRM, Google Analytics and Configurix dashboards as the single source of truth.
KPI 1 — Configurator-to-Lead Conversion Rate
- What it measures: Percentage of configurator sessions that become captured leads (contact submitted, quote requested or booked appointment).
- How to calculate: (Leads from configurator ÷ Total configurator sessions) × 100.
- First-year target: 3–8% of configurator visitors (varies by traffic quality and widget placement).
- Why it matters: This is your primary funnel metric for how well the widget qualifies website visitors into sales opportunities.
- How Configurix helps: Embeddable configurator widgets, lead-capture forms, and multi-step wizards reduce friction and increase qualified submissions; built-in analytics ties each lead to the originating session so the conversion rate is precise.
KPI 2 — Time-to-First-Quote (Sales Efficiency)
- What it measures: Median time from lead capture to a delivered, branded quote.
- How to calculate: Median(Date quote sent − Date lead captured).
- First-year target: < 1 business day for sales teams; < 15 minutes for in-field or self-serve quotes.
- Why it matters: Faster quotes close more deals and reduce the chance of price-shopping.
- How Configurix helps: Automatic pricing and rules-based product logic convert any live configuration into an itemized, branded PDF quote in seconds — eliminating spreadsheets and manual re-entry. Quoting best practices recommend automating validation and output to protect margin and speed response. (fpx.com)
KPI 3 — Quote-to-Order Conversion (Close Rate)
- What it measures: Percentage of quotes that become signed orders.
- How to calculate: (Signed contracts ÷ Quotes issued) × 100.
- First-year target: 20–45% depending on lead source and sales model; field sales with AR often hit higher bands.
- Why it matters: This KPI shows whether your configurator + quoting process is actually converting intent into revenue.
- How Configurix helps: Photoreal real-time 3D and AR preview on the customer’s own home reduces uncertainty and increases on-the-spot decisions. Branded PDFs, e-sign-ready contracts and automated follow-ups keep momentum and reduce quote friction.
KPI 4 — Average Order Value (AOV)
- What it measures: Average revenue per signed order.
- How to calculate: Total revenue from configurator-sourced orders ÷ Number of signed orders.
- First-year target: +10–30% uplift over non-configurator channels as customers add upgrade options and accessories.
- Why it matters: Higher AOV directly improves profit and payback time on the configurator project.
- How Configurix helps: Live option pricing and realistic 3D previews encourage upgrades (lighting kits, motorization, screens). Real-time pricing rules prevent undercharging while enabling guided upsell.
KPI 5 — Quote Accuracy & Rework Rate (Operational Risk)
- What it measures: Percentage of projects requiring rework, change orders, or re-measure visits after an order is placed.
- How to calculate: (Projects with rework ÷ Total projects) × 100.
- First-year target: < 5–8% for installers who deploy configurator-driven workflows.
- Why it matters: Rework kills margin, causes delays and damages customer satisfaction.
- How Configurix helps: Configurations export engineering-accurate dimensions and manufacturing data, auto-generate 2D plans and install checklists, and attach site photos and signed contracts to the project record — reducing miscommunication and re-entry errors. Quoting and CPQ guidance emphasizes automation to eliminate manual calculation errors. (cdn.selecthub.com)
KPI 6 — Lead-to-Install Cycle Time (Speed to Cash)
- What it measures: Median days from initial captured lead to completed installation.
- How to calculate: Median(Date install completed − Date lead captured).
- First-year target: Reduce cycle time by 20–50% versus prior manual workflows.
- Why it matters: Shorter cycles improve cash flow and customer satisfaction; fewer lost opportunities.
- How Configurix helps: The platform unifies CRM, calendar scheduling, crew task assignment, automated pre-install reminders, and digital contract signing so the whole funnel flows without handoffs.
KPI 7 — Return Rate & Customer Satisfaction
- What it measures: Returns, cancellations, and NPS/CSAT from configurator-sourced customers.
- How to calculate: Return rate = (Refunded/cancelled projects ÷ Total projects). Track CSAT/NPS via post-install surveys attached to each project record.
- First-year target: Lower return/cancellation rates than non-AR channels; CSAT increase by several points.
- Why it matters: High satisfaction correlates with referrals and repeat business in the outdoor living market.
- How Configurix helps: AR previews on the customer’s real home set realistic expectations. Clear, branded proposals and digital contracts reduce disputes and improve perceived professionalism. Industry data shows AR increases purchase confidence and can raise conversion and satisfaction metrics. (businesswire.com)
Dashboard & Data sources: what to wire up
Track these KPIs from three sources:
- Configurix CRM and analytics (quote records, signed contracts, install dates).
- Web analytics (configurator sessions, widget events, UTM-tagged traffic).
- Finance/ERP (actual revenue and returns).
Recommended events to instrument immediately:
- session.start (widget open)
- config.saved (snapshot saved)
- lead.submitted (contact or quote request)
- quote.generated (PDF created)
- contract.signed (e-sign event)
- install.scheduled / install.completed
Table — KPI summary and which Configurix feature moves it
| KPI | How to calculate | Target (Yr1) | Configurix feature that moves it |
|---|---|---|---|
| Configurator-to-Lead Conversion | Leads ÷ sessions × 100 | 3–8% | Embeddable widgets, multi-step capture, widget analytics |
| Time-to-First-Quote | Median(hours/days) | <1 day (sales); <15 min (self-serve) | Automatic pricing, branded PDF generation |
| Quote-to-Order Conversion | Orders ÷ quotes × 100 | 20–45% | Real-time 3D + AR, e-sign, automated follow-ups |
| Average Order Value | Revenue ÷ orders | +10–30% uplift | Live option pricing, guided upsell in 3D |
| Quote Accuracy & Rework Rate | Rework ÷ projects × 100 | <5–8% | Engineering-accurate exports, 2D plans, install checklists |
| Lead-to-Install Cycle Time | Median(days) | −20–50% vs manual | CRM, shared calendar, task workflows |
| Return Rate & CSAT | Returns ÷ projects; NPS/CSAT | Lower vs baseline | AR preview, branded contracts, project portal |
Practical tips for getting reliable KPI data
- Single source of truth: route every configurator lead into Configurix CRM automatically (no manual CSV imports).
- Apply UTM tracking to widgets so you can segment conversion rates by campaign or channel.
- Use quote snapshots: store the configuration that produced each quote so you can audit rework causes.
- Set up automated CSAT prompts after install completion and tie responses to the originating quote.
- Run a 90-day baseline before making feature changes — compare month-over-month.
Benchmarks & expectations
Benchmarks vary by business model. Self-serve eCommerce-style flows tend to show higher configurator-to-lead engagement but lower close rates than well-trained field sales using AR in-home. Published industry studies report significant lifts in conversion and engagement from high-quality 3D and AR experiences; use those findings as directional benchmarks while you build your own historical data. (3dcloud.com)
Common pitfalls to avoid
- Tracking only top-of-funnel metrics. You must connect leads to quotes, signed contracts and installs to measure real impact.
- Ignoring rework data. A small rework percentage can erase margin gains from higher AOV.
- Over-optimizing for clicks. Engagement metrics matter, but revenue and installs are the final word.
Why Configurix is the practical choice for hitting these KPIs
Configurix is built to move revenue, not just produce pretty visuals. Converting a configuration into an install-ready project requires: accurate, rules-driven pricing; branded and itemized PDF quotes; digital contract signing; AR preview on the customer’s real home; and a shared operations calendar that ties jobs to crews. Configurix delivers all of these in one white-label platform, so you track and improve the seven KPIs above without stitching multiple tools together.
Get started: a suggested 90-day launch playbook
- Week 0–2: Install the embeddable widget on your highest-traffic product pages and link it from your showroom. (See Pergola and Awning product pages for quick demos.)
- Week 2–6: Configure pricing rules, generate sample quotes and set up e-sign templates.
- Week 6–12: Train sales and install crews on the app; begin capturing CSAT; turn on calendar automation.
- Week 12–90: Monitor the seven KPIs, iterate on widget placement, and run A/B tests on quote templates and upsell flows.
Start measuring ROI today
If you want a repeatable way to prove value from 3D and AR, begin with these seven KPIs and instrument them end-to-end. Configurix provides the real-time 3D engine, AR site preview, automatic pricing, branded PDF quotes, digital contracts and lead-to-install workflows you need to move each metric — and the white-label option to keep your brand front-and-center.
Explore Configurix product pages and book a demo:
- Pergola Configurator: /products/pergola-configurator
- Awning Configurator: /products/awning-configurator
- Learn about our platform and approach: /
Sources
PwC — Immersive technology trends (2024) Clutch (BusinessWire) — AR adoption report (2026) 3D Cloud — 3D in Retail: Facts and Figures (2023) FPX — Quoting Best Practices (2024) SelectHub — Best Practice Guide (2022)
Ready to try Configurix?
See how the configurator, quoting and CRM work together for your business.
Book a demo →Related articles
Digitale contracten voor pergola‑projecten: veilig, sneller en foutloos verkopen
Hoe digitale handtekeningen + real‑time 3D/AR‑configuratie offertes, contracten en planning voor pergola's en zonwering versnellen — juridisch veilig, meetbaar sneller en klaar voor productie.
ROI van een 3D/AR-configurator voor pergola's en veranda's: rekenmodel en KPI’s
Concreet stappenplan om ROI van een 3D/AR-configurator voor buitenproducten te berekenen: conversie, site‑visit reductie, foutreductie en payback‑tijd. Inclusief rekenvoorbeeld en KPI‑dashboard.
Instant offertes zonder site‑bezoek: pergola & zonwering betrouwbaar prijs geven met AR
Leer stap voor stap hoe je betrouwbare instant‑offertes voor pergola’s, veranda’s en zonwering afgeeft zonder onnodige site‑bezoeken — met AR, realtime 3D en automatische prijzen.